")
There’s nothing worse than being stalled behind a convoy, but how many hours did the average Edmontonians spend stuck between point A to Point B in 2022? Well, thanks to TomTom and their Traffic Index, we actually have the answer – and it may come as a surprise!
Every year since 2011, TomTom has analyzed the traffic trends of 389 cities in 56 countries and what they have found in the process is interesting and beneficial.
Recent Posts:
This new breakfast spot on Edmonton Trail looks incredible
Edmonton Sport & Social just opened its Spring 2023 registration & here’s everything to know
View this post on Instagram
Based on floating car data (FCD) collected from a variety of sources, the company hopes that this study can provide insight that will help fleet managers, city planners, carmakers, policymakers and drivers “tackle traffic-related challenges, make informed mobility decisions – and steer towards a better future.”
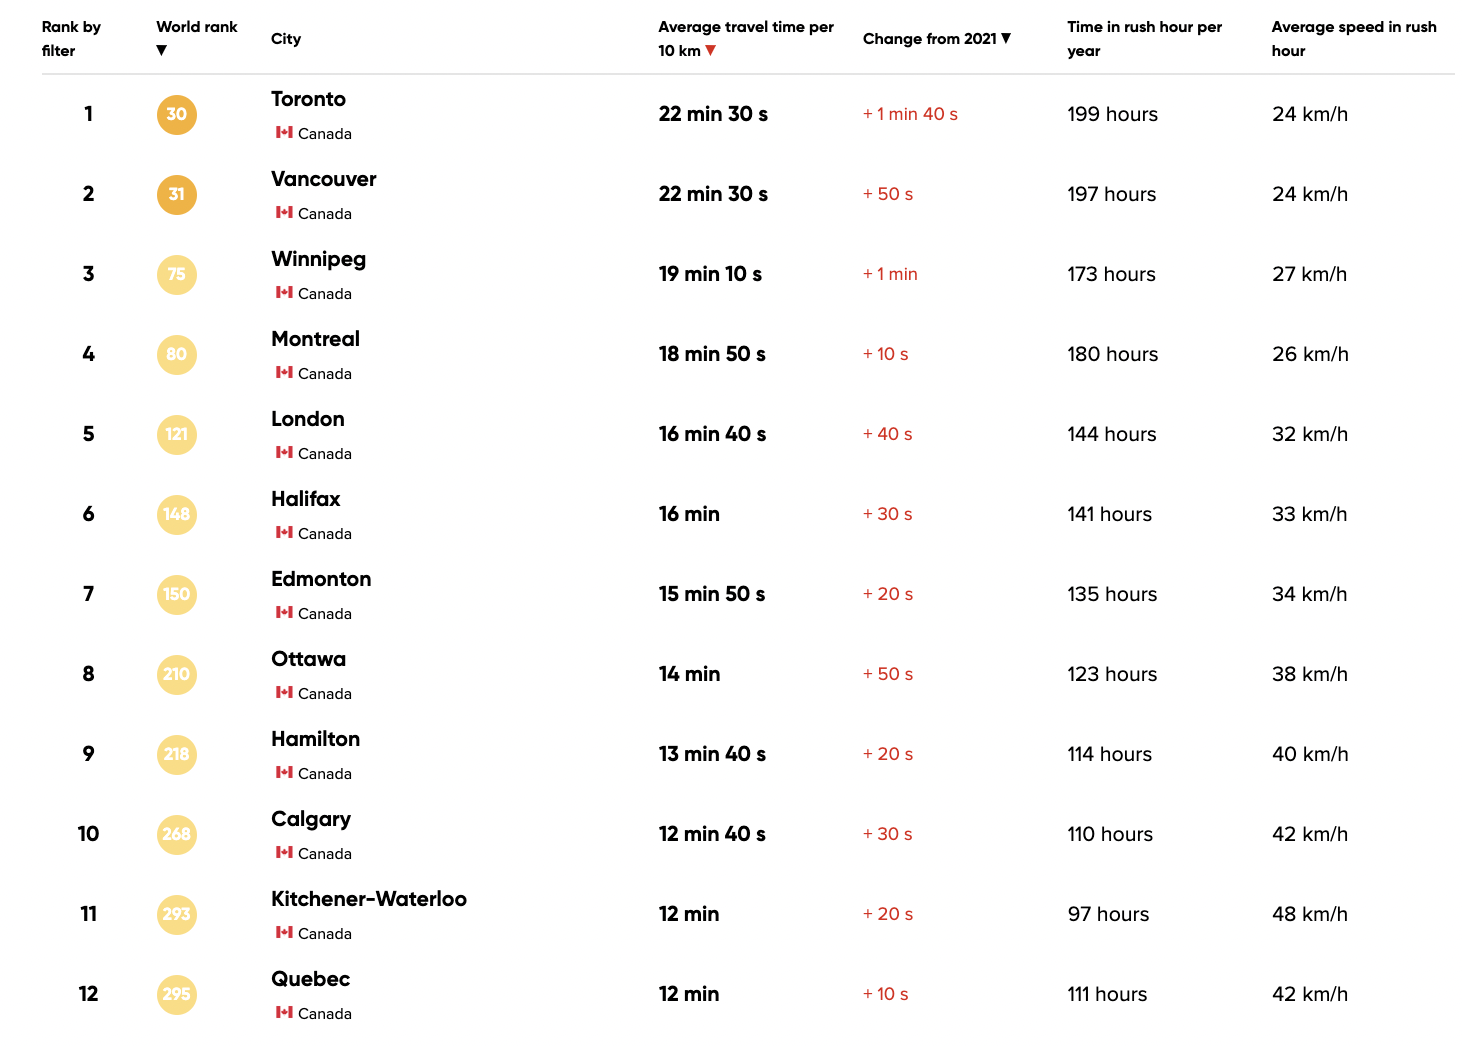
Want to know where Canada’s biggest cities ranked?
This year, Toronto placed 30th in the entire world (and first in the country), with residents spending an average of 22 minutes and 30 seconds per 10 km, which is actually up from last year.
The 6, was then followed by Vancouver at #31 globally and 2nd in Canada – but Edmonton? With an average of 15 minutes and 50 seconds per 10 km, we placed 150th overall, and 7th in the country.
Sadly, TomTom found that the average travel time increased in 62% of the cities – but that’s not all.
In addition to this, energy prices and driving costs also went up all over the world, so here’s to hoping that changes in 2023.
While you’re waiting for a miracle, save your pennies, scope out a solid playlist and relax. We have a sneaky suspicion that this year will be quite the ride and you’re going to want to be comfortable.


